0
Introduction to Tidyverse
Paul E. Santos Andrade
Plant Functional Trait Course - PFCT5
Getting Started
You will learn the basics of and data science, and practice using the RStudio IDE (integrated development environment). We'll discuss about data transformation and tidying with dplyr and tidyr.
If you want to transition from coding in base R to the tidyverse, or just jump into doing data science in the tidyverse without any prior R experience.
Here we will work on the first steps!
Prework
You may need to install the following:
A recent version of R (~3.6.3), which is available for free at cran.r-project.org
A recent version of RStudio IDE (~1.2.5033), available for free at www.rstudio.com/download.
Prework
- The set of relevant R packages, which you can install by connecting to the internet, opening RStudio, and running:
packages <- c("tidyverse", "janitor", "skimr", "here", "writexl", "readxl", "cowplot", "patchwork", "RColorBrewer", "learnr") install.packages(packages)Using packages
1
install.packages("vegan")Download files
One time per computer
2
library(vegan)In each session
Your Turn
02:00
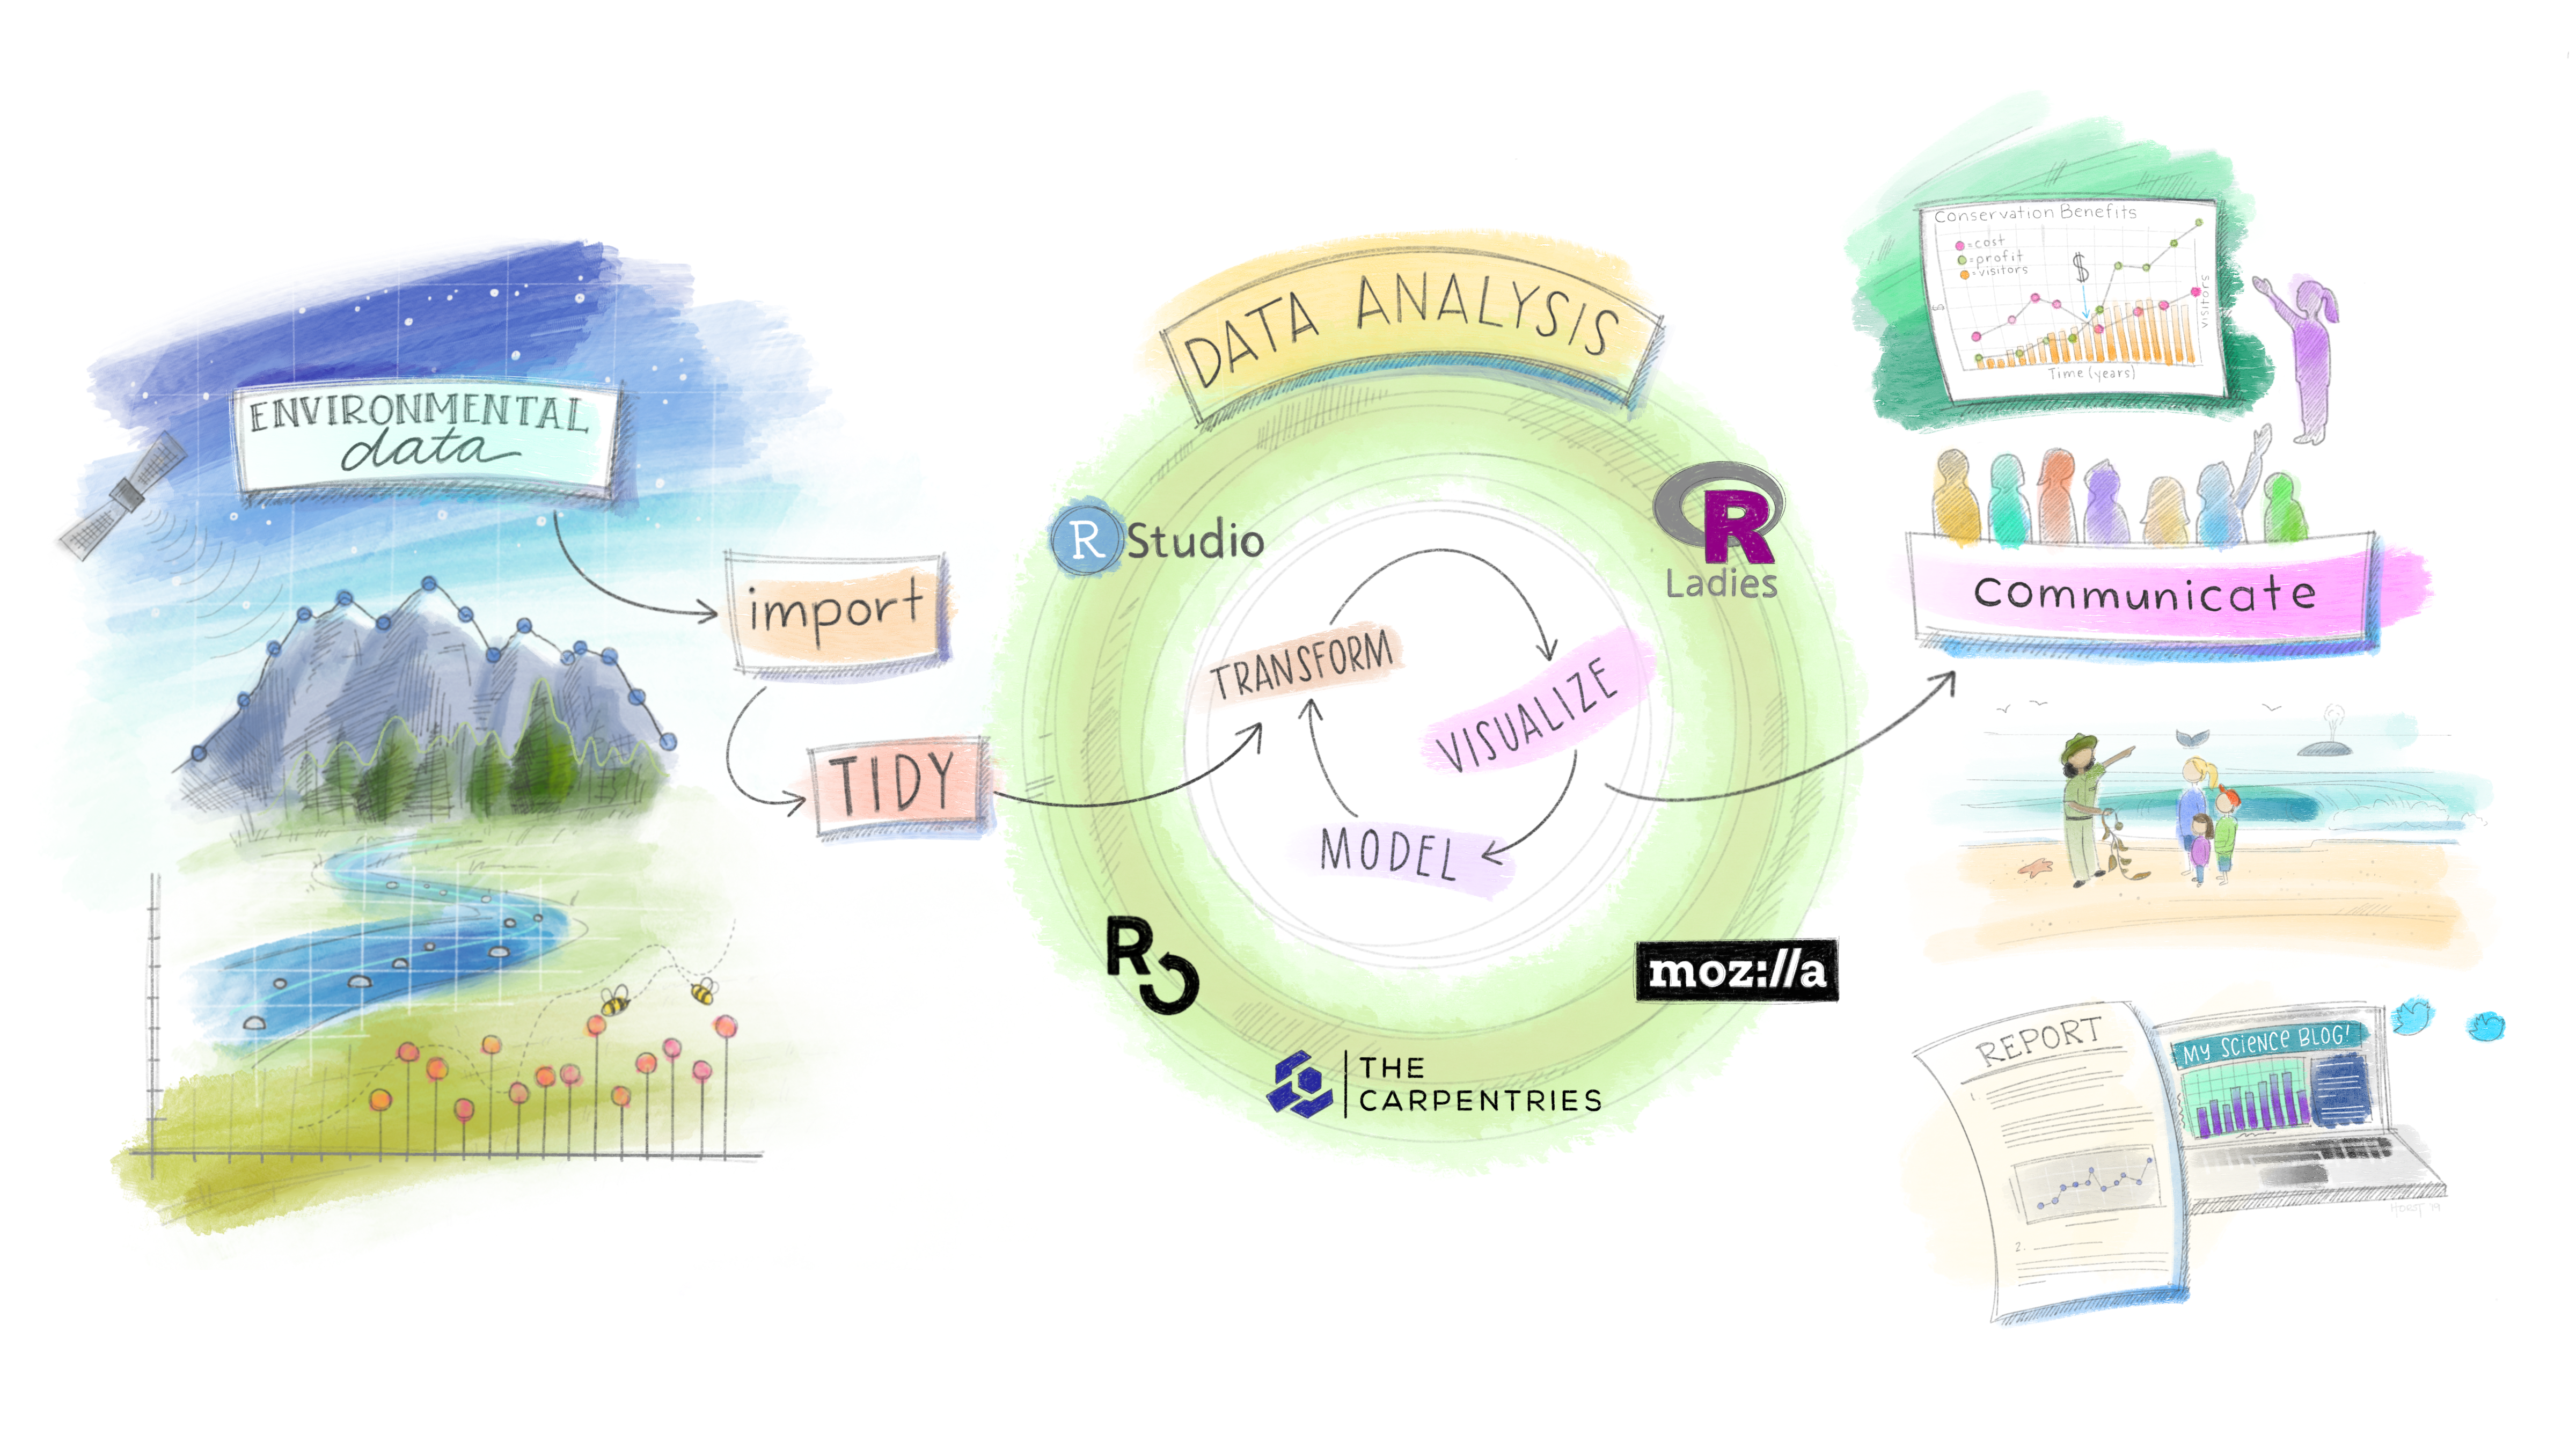
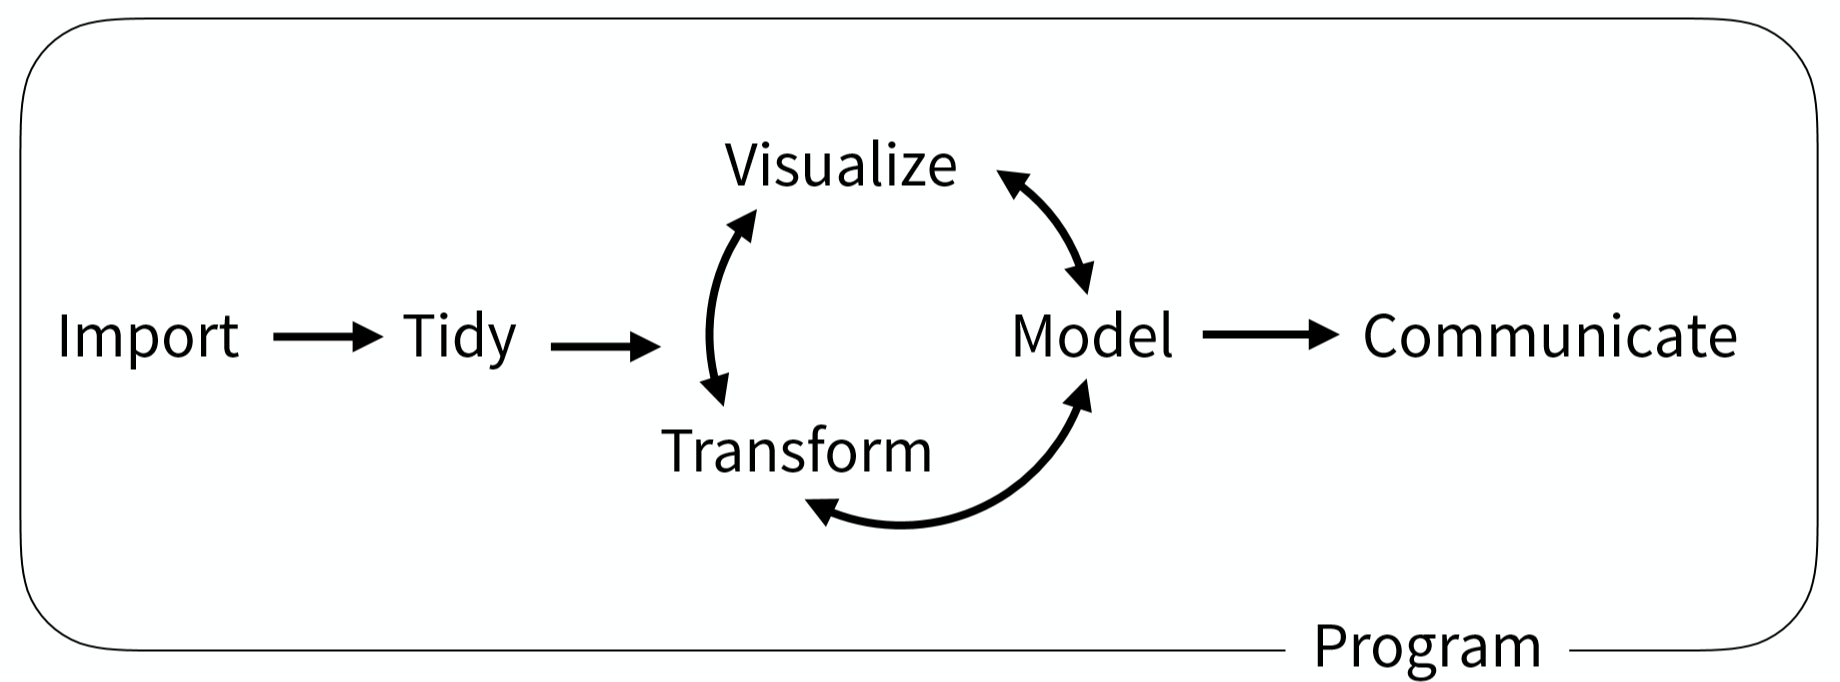
Data science workflow
RStudio Projects
Keeping all the files associated with a project organized together – input data, R scripts, results and figures.

Import data

library(readr)read_csv(".../")read_tsv(".../")read_delim(".../")
library(readxl)read_xls(".../")read_xlsx(".../")Import data
chem_trait <- read_csv("data/PFTC1.2_China_2015_2016_ChemicalTraits.csv")chem_trait %>% names()## [1] "Date" "Elevation" "Site" "destBlockID" "Treatment" ## [6] "Taxon" "StoichLabel" "P_percent" "C_percent" "N_percent" ## [11] "CN_ratio" "dN15_percent" "dC13_percent" "n" "CNP_Comment"The pipe operator
Passes result on left into first argument of function on right.

clean_names(chem_trait)chem_trait %>% clean_names()janitor::clean_names().
chem_trait <- read_csv("data/PFTC1.2_China_2015_2016_ChemicalTraits.csv") %>% clean_names()chem_trait %>% names()## [1] "date" "elevation" "site" "dest_block_id"## [5] "treatment" "taxon" "stoich_label" "p_percent" ## [9] "c_percent" "n_percent" "cn_ratio" "d_n15_percent"## [13] "d_c13_percent" "n" "cnp_comment"Your Turn
01:00
dplyr

A package that transforms data. dplyr implements a grammar for transforming tabular data.
Isolating data
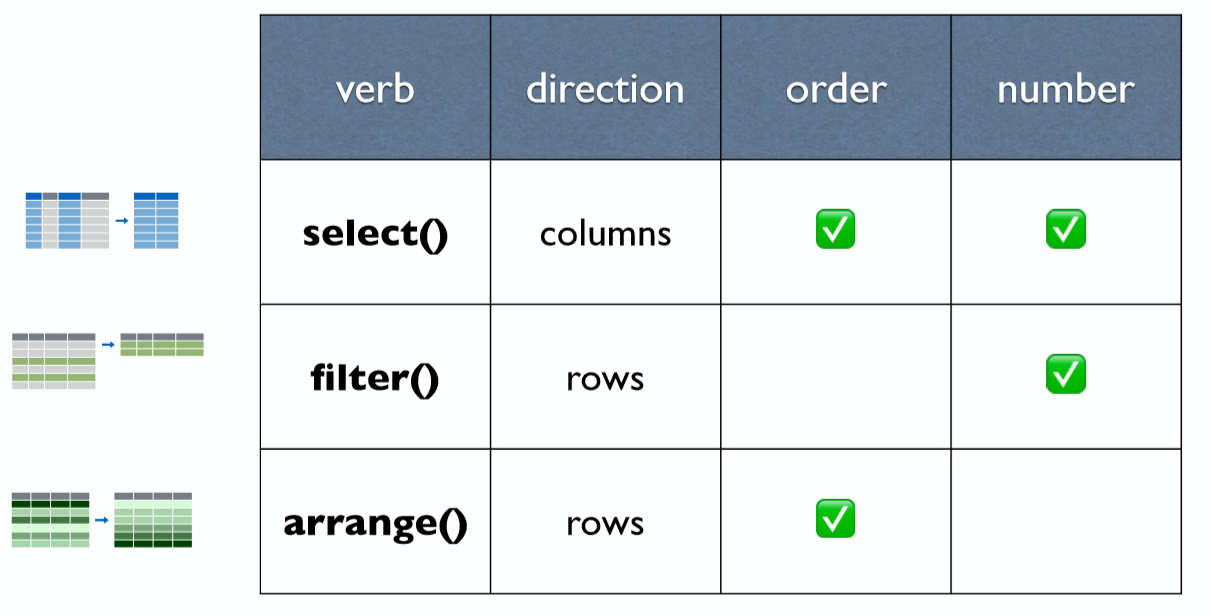
select()
chem_trait## # A tibble: 576 x 15## date elevation site dest_block_id treatment taxon stoich_label## <date> <dbl> <chr> <chr> <chr> <chr> <chr> ## 1 2015-08-20 3500 M MO LOCAL Poly~ 164 ## 2 2015-08-20 3850 A AO LOCAL Poly~ 198 ## 3 2015-08-20 3500 M MO LOCAL Poly~ 163 ## 4 2015-08-20 3000 L LO LOCAL Poly~ 113 ## 5 2015-08-20 4100 H HO LOCAL Rhod~ 224 ## 6 2015-08-20 3500 M MO LOCAL Rhod~ 172 ## 7 2015-08-20 3850 A AO LOCAL Hemi~ 186 ## 8 2015-08-20 3500 M MO LOCAL Clin~ 134 ## 9 2015-08-20 3000 L LO LOCAL Swer~ 122 ## 10 2015-08-20 3500 M MO LOCAL Hemi~ 145 ## # ... with 566 more rows, and 8 more variables: p_percent <dbl>,## # c_percent <dbl>, n_percent <dbl>, cn_ratio <dbl>, d_n15_percent <dbl>,## # d_c13_percent <dbl>, n <dbl>, cnp_comment <chr>select() - Extract columns by name.
chem_trait %>% select(date, site, taxon)## # A tibble: 576 x 3## date site taxon ## <date> <chr> <chr> ## 1 2015-08-20 M Polygonum cyanandrum ## 2 2015-08-20 A Polygonum cyanandrum ## 3 2015-08-20 M Polygonum cyanandrum ## 4 2015-08-20 L Polygonum cyanandrum ## 5 2015-08-20 H Rhodiola fastigiata ## 6 2015-08-20 M Rhodiola yunnanensis ## 7 2015-08-20 A Hemiphragma heterophyllum## 8 2015-08-20 M Clinopodium polycephalum ## 9 2015-08-20 L Swertia macrosperma ## 10 2015-08-20 M Hemiphragma heterophyllum## # ... with 566 more rowsselect() - Select every column but
chem_trait %>% select(-c(date, elevation, site))## # A tibble: 576 x 12## dest_block_id treatment taxon stoich_label p_percent c_percent n_percent## <chr> <chr> <chr> <chr> <dbl> <dbl> <dbl>## 1 MO LOCAL Poly~ 164 0.0984 44.0 2.48## 2 AO LOCAL Poly~ 198 0.218 44.1 2.85## 3 MO LOCAL Poly~ 163 0.0983 45.8 3.06## 4 LO LOCAL Poly~ 113 0.0587 44.6 2.51## 5 HO LOCAL Rhod~ 224 0.128 46.6 2.64## 6 MO LOCAL Rhod~ 172 0.101 42.2 2.14## 7 AO LOCAL Hemi~ 186 0.122 47.4 1.83## 8 MO LOCAL Clin~ 134 0.124 46.0 3.05## 9 LO LOCAL Swer~ 122 0.206 48.7 2.43## 10 MO LOCAL Hemi~ 145 0.0632 48.6 2.07## # ... with 566 more rows, and 5 more variables: cn_ratio <dbl>,## # d_n15_percent <dbl>, d_c13_percent <dbl>, n <dbl>, cnp_comment <chr>select() - Rename variables
chem_trait %>% select( date, site)## # A tibble: 576 x 2## date site ## <date> <chr>## 1 2015-08-20 M ## 2 2015-08-20 A ## 3 2015-08-20 M ## 4 2015-08-20 L ## 5 2015-08-20 H ## 6 2015-08-20 M ## 7 2015-08-20 A ## 8 2015-08-20 M ## 9 2015-08-20 L ## 10 2015-08-20 M ## # ... with 566 more rowschem_trait %>% select( time = date, location = site)## # A tibble: 576 x 2## time location## <date> <chr> ## 1 2015-08-20 M ## 2 2015-08-20 A ## 3 2015-08-20 M ## 4 2015-08-20 L ## 5 2015-08-20 H ## 6 2015-08-20 M ## 7 2015-08-20 A ## 8 2015-08-20 M ## 9 2015-08-20 L ## 10 2015-08-20 M ## # ... with 566 more rowsselect()
: - select a range of columns
chem_trait %>% select(date:taxon)## # A tibble: 576 x 6## date elevation site dest_block_id treatment taxon ## <date> <dbl> <chr> <chr> <chr> <chr> ## 1 2015-08-20 3500 M MO LOCAL Polygonum cyanandrum ## 2 2015-08-20 3850 A AO LOCAL Polygonum cyanandrum ## 3 2015-08-20 3500 M MO LOCAL Polygonum cyanandrum ## 4 2015-08-20 3000 L LO LOCAL Polygonum cyanandrum ## 5 2015-08-20 4100 H HO LOCAL Rhodiola fastigiata ## 6 2015-08-20 3500 M MO LOCAL Rhodiola yunnanensis ## 7 2015-08-20 3850 A AO LOCAL Hemiphragma heterophyllum## 8 2015-08-20 3500 M MO LOCAL Clinopodium polycephalum ## 9 2015-08-20 3000 L LO LOCAL Swertia macrosperma ## 10 2015-08-20 3500 M MO LOCAL Hemiphragma heterophyllum## # ... with 566 more rowsselect()
start_with - Select columns that start with...
chem_trait %>% select(starts_with("cn"))## # A tibble: 576 x 2## cn_ratio cnp_comment## <dbl> <chr> ## 1 17.8 <NA> ## 2 15.5 <NA> ## 3 15.0 <NA> ## 4 17.8 <NA> ## 5 17.6 <NA> ## 6 19.7 <NA> ## 7 25.8 <NA> ## 8 15.1 <NA> ## 9 20.1 <NA> ## 10 23.4 <NA> ## # ... with 566 more rowsfilter() - Extract rows that meet logical criteria
chem_trait %>% select(treatment, taxon) %>% filter(treatment == "OTC")## # A tibble: 74 x 2## treatment taxon ## <chr> <chr> ## 1 OTC Potentilla leuconota ## 2 OTC Potentilla leuconota ## 3 OTC Plantago asiatica ## 4 OTC Potentilla leuconota ## 5 OTC Plantago asiatica ## 6 OTC Potentilla leuconota ## 7 OTC Potentilla leuconota ## 8 OTC Epilobium fangii ## 9 OTC Viola biflora var. rockiana## 10 OTC Artemisia flaccida ## # ... with 64 more rowsfilter( )
chem_trait %>% select(treatment, taxon) %>% filter(treatment == "OTC", taxon == "Epilobium fangii")## # A tibble: 9 x 2## treatment taxon ## <chr> <chr> ## 1 OTC Epilobium fangii## 2 OTC Epilobium fangii## 3 OTC Epilobium fangii## 4 OTC Epilobium fangii## 5 OTC Epilobium fangii## 6 OTC Epilobium fangii## 7 OTC Epilobium fangii## 8 OTC Epilobium fangii## 9 OTC Epilobium fangiiLogical tests
| Operator | Meaning |
|---|---|
| x < y | Less than |
| x > y | Greater than |
| x == y | Equal to |
| x <= y | Less than or equal to |
| x >= y | Greater than or equal to |
| x != y | Not equal to |
| x %in% y | Group membership |
| is.na(x) | Is NA |
| !is.na(x) | Is not NA |
Boolean operator
| Operator | Meaning | |
|---|---|---|
| a & b | and | |
| "a | b" | or |
| !a | not | |
| a %in% c(a, b) | one of (in) |
%in%
chem_trait %>% select(site, treatment) %>% filter(treatment %in% c("LOCAL", "OTC", "O"))## # A tibble: 8 x 2## site treatment## <chr> <chr> ## 1 M LOCAL ## 2 A LOCAL ## 3 L LOCAL ## 4 H LOCAL ## 5 L OTC ## 6 A OTC ## 7 M OTC ## 8 H OTCarrange( )
chem_trait %>% select(elevation, site)## # A tibble: 576 x 2## elevation site ## <dbl> <chr>## 1 3500 M ## 2 3850 A ## 3 3500 M ## 4 3000 L ## 5 4100 H ## 6 3500 M ## 7 3850 A ## 8 3500 M ## 9 3000 L ## 10 3500 M ## # ... with 566 more rowschem_trait %>% select(elevation, site) %>% arrange(elevation)## # A tibble: 576 x 2## elevation site ## <dbl> <chr>## 1 3000 L ## 2 3000 L ## 3 3000 L ## 4 3000 L ## 5 3000 L ## 6 3000 L ## 7 3000 L ## 8 3000 L ## 9 3000 L ## 10 3000 L ## # ... with 566 more rowsarrange(. , desc())
chem_trait %>% select(elevation, site)## # A tibble: 576 x 2## elevation site ## <dbl> <chr>## 1 3500 M ## 2 3850 A ## 3 3500 M ## 4 3000 L ## 5 4100 H ## 6 3500 M ## 7 3850 A ## 8 3500 M ## 9 3000 L ## 10 3500 M ## # ... with 566 more rowschem_trait %>% select(elevation, site) %>% arrange(desc(elevation))## # A tibble: 576 x 2## elevation site ## <dbl> <chr>## 1 4100 H ## 2 4100 H ## 3 4100 H ## 4 4100 H ## 5 4100 H ## 6 4100 H ## 7 4100 H ## 8 4100 H ## 9 4100 H ## 10 4100 H ## # ... with 566 more rowsYour Turn
01:00
Deriving Information
mutate() - create new variables
chem_trait %>% select(site, elevation, c_percent) %>% mutate(c_percent_prop = c_percent/10)## # A tibble: 576 x 4## site elevation c_percent c_percent_prop## <chr> <dbl> <dbl> <dbl>## 1 M 3500 44.0 4.40## 2 A 3850 44.1 4.41## 3 M 3500 45.8 4.58## 4 L 3000 44.6 4.46## 5 H 4100 46.6 4.66## 6 M 3500 42.2 4.22## 7 A 3850 47.4 4.74## 8 M 3500 46.0 4.60## 9 L 3000 48.7 4.87## 10 M 3500 48.6 4.86## # ... with 566 more rowsmutate()
chem_trait %>% select(site, elevation, c_percent, p_percent) %>% mutate(c_p_percent = c_percent + p_percent)## # A tibble: 576 x 5## site elevation c_percent p_percent c_p_percent## <chr> <dbl> <dbl> <dbl> <dbl>## 1 M 3500 44.0 0.0984 44.1## 2 A 3850 44.1 0.218 44.4## 3 M 3500 45.8 0.0983 45.9## 4 L 3000 44.6 0.0587 44.7## 5 H 4100 46.6 0.128 46.7## 6 M 3500 42.2 0.101 42.3## 7 A 3850 47.4 0.122 47.5## 8 M 3500 46.0 0.124 46.1## 9 L 3000 48.7 0.206 49.0## 10 M 3500 48.6 0.0632 48.7## # ... with 566 more rowssummarise() - summarize()
chem_trait %>% summarise(lowest_elev = min(elevation), hight_elev = max(elevation))## # A tibble: 1 x 2## lowest_elev hight_elev## <dbl> <dbl>## 1 3000 4100summarise()
n(), number of observations
n_distinct(), number of unique values
chem_trait %>% summarise(n_entries = n(), n_treatment = n_distinct(treatment))## # A tibble: 1 x 2## n_entries n_treatment## <int> <int>## 1 576 8Number of species
chem_trait %>% summarise(n_species = n_distinct(taxon))## # A tibble: 1 x 1## n_species## <int>## 1 63Your Turn
01:00
Splitting the data
group_by()
Takes an existing tbl and converts it into a grouped tbl where operations are performed by group.
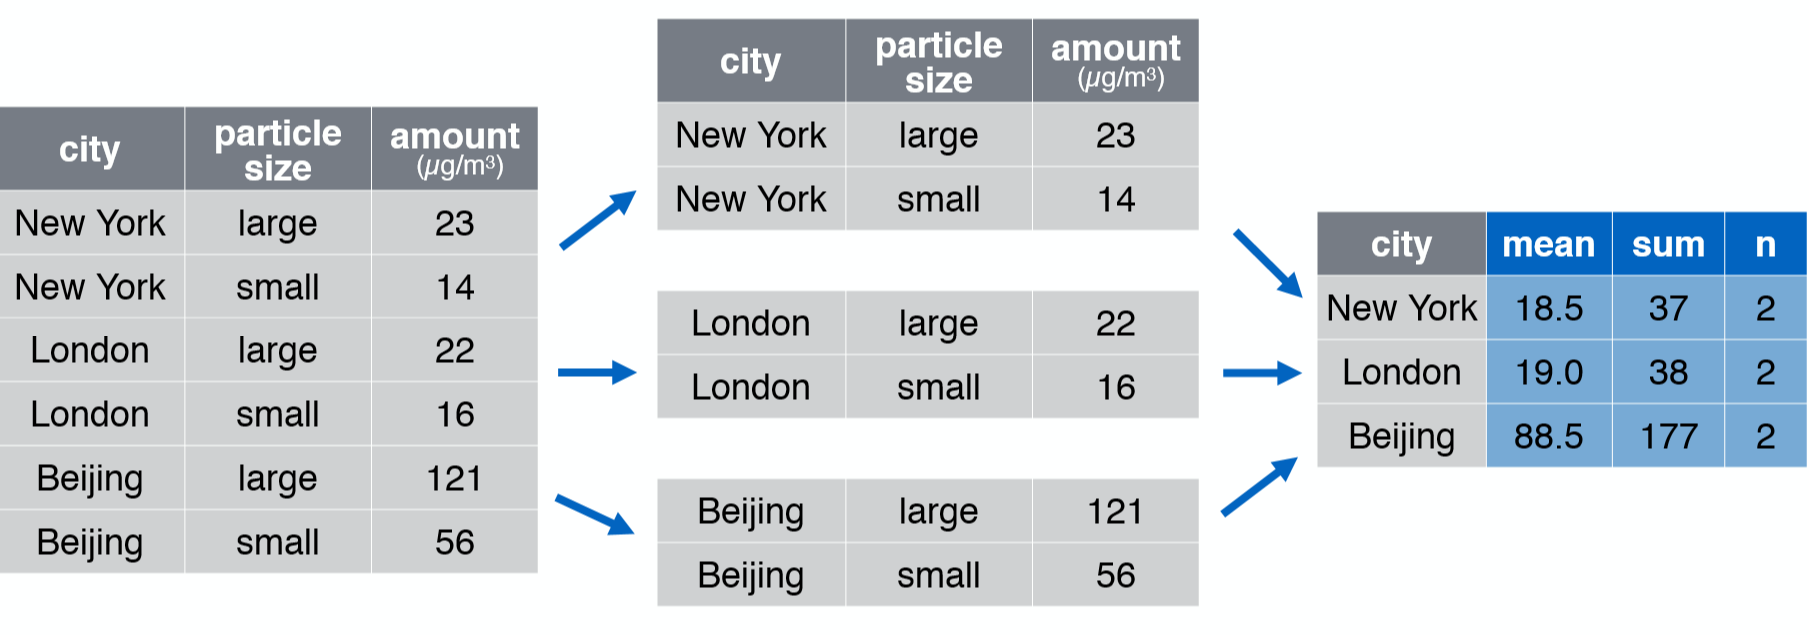
group_by() %>% summarise()
chem_trait %>% group_by(site) %>% summarise(n_samples = n(), n_species = n_distinct(taxon), mean_p_percent = mean(p_percent))## # A tibble: 4 x 4## site n_samples n_species mean_p_percent## <chr> <int> <int> <dbl>## 1 A 144 25 NA ## 2 H 107 25 0.154## 3 L 113 24 NA ## 4 M 212 31 0.145group_by() %>% summarise()
chem_trait %>% group_by(site, treatment) %>% summarise(n_samples = n(), n_species = n_distinct(taxon), mean_p_percent = mean(p_percent))## # A tibble: 24 x 5## # Groups: site [4]## site treatment n_samples n_species mean_p_percent## <chr> <chr> <int> <int> <dbl>## 1 A 0 16 4 0.165## 2 A 1 12 6 0.180## 3 A 2 16 7 0.167## 4 A C 20 5 0.164## 5 A LOCAL 55 15 NA ## 6 A OTC 25 6 0.157## 7 H 0 5 2 0.160## 8 H 2 21 6 0.160## 9 H 4 7 3 0.124## 10 H C 8 2 0.155## # ... with 14 more rowschem_trait %>% group_by(site) %>% summarise(n_samples = n(), n_species = n_distinct(taxon), mean_p_percent = mean(p_percent), n_of_na = sum(is.na(p_percent)))## # A tibble: 4 x 5## site n_samples n_species mean_p_percent n_of_na## <chr> <int> <int> <dbl> <int>## 1 A 144 25 NA 1## 2 H 107 25 0.154 0## 3 L 113 24 NA 1## 4 M 212 31 0.145 0chem_trait %>% group_by(site) %>% summarise(n_samples = n(), n_species = n_distinct(taxon), mean_p_percent = mean(p_percent, na.rm = TRUE), n_of_na = sum(is.na(p_percent)))## # A tibble: 4 x 5## site n_samples n_species mean_p_percent n_of_na## <chr> <int> <int> <dbl> <int>## 1 A 144 25 0.172 1## 2 H 107 25 0.154 0## 3 L 113 24 0.176 1## 4 M 212 31 0.145 0ungroup()
chem_trait %>% group_by(site) %>% summarise(n_samples = n(), n_species = n_distinct(taxon), mean_p_percent = mean(p_percent, na.rm = TRUE)) %>% ungroup()## # A tibble: 4 x 4## site n_samples n_species mean_p_percent## <chr> <int> <int> <dbl>## 1 A 144 25 0.172## 2 H 107 25 0.154## 3 L 113 24 0.176## 4 M 212 31 0.145Your Turn
01:00
tidyr
A package that reshapes the layout of tabular data.
"Data comes in many formats, but R prefers just one: tidy data. "
- Garrett Grolemund
Tdidy Data
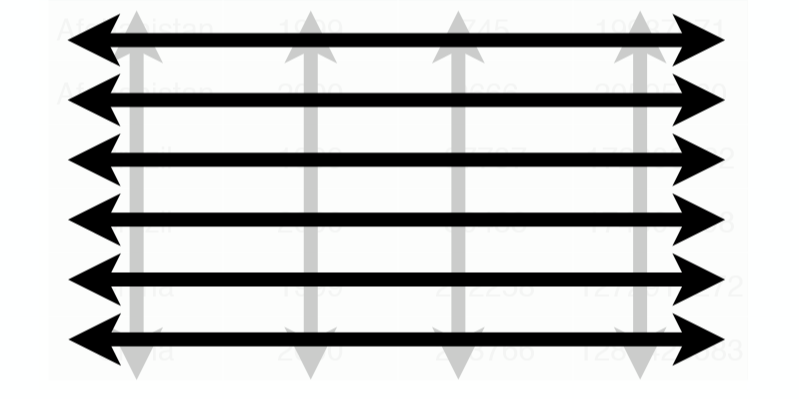
A data set is tidy if:
Each variable is in its own
column.Each case is in its own
row.Each value is in its own
cell.
"Tidy data sets are all alike; but every messy data set is messy in its own way."
- Hadley Wickham
separate()
chem_trait %>% select(site, taxon) %>% separate(taxon, c("genus", "specie"))## # A tibble: 576 x 3## site genus specie ## <chr> <chr> <chr> ## 1 M Polygonum cyanandrum ## 2 A Polygonum cyanandrum ## 3 M Polygonum cyanandrum ## 4 L Polygonum cyanandrum ## 5 H Rhodiola fastigiata ## 6 M Rhodiola yunnanensis ## 7 A Hemiphragma heterophyllum## 8 M Clinopodium polycephalum ## 9 L Swertia macrosperma ## 10 M Hemiphragma heterophyllum## # ... with 566 more rowsunite()
chem_trait %>% select(site, dest_block_id)## # A tibble: 576 x 2## site dest_block_id## <chr> <chr> ## 1 M MO ## 2 A AO ## 3 M MO ## 4 L LO ## 5 H HO ## 6 M MO ## 7 A AO ## 8 M MO ## 9 L LO ## 10 M MO ## # ... with 566 more rowschem_trait %>% select(site, dest_block_id) %>% unite("site_dest", site, dest_block_id, sep = "_" )## # A tibble: 576 x 1## site_dest## <chr> ## 1 M_MO ## 2 A_AO ## 3 M_MO ## 4 L_LO ## 5 H_HO ## 6 M_MO ## 7 A_AO ## 8 M_MO ## 9 L_LO ## 10 M_MO ## # ... with 566 more rowspivot_wider()
df %>% pivot_wider(everything(), names_from = "...", values_from = "...")df %>% pivot_wider(-c(...), names_from = "...", values_from = "...")df %>% pivot_wider(-var, names_from = "...", values_from = "...")pivot_wider()
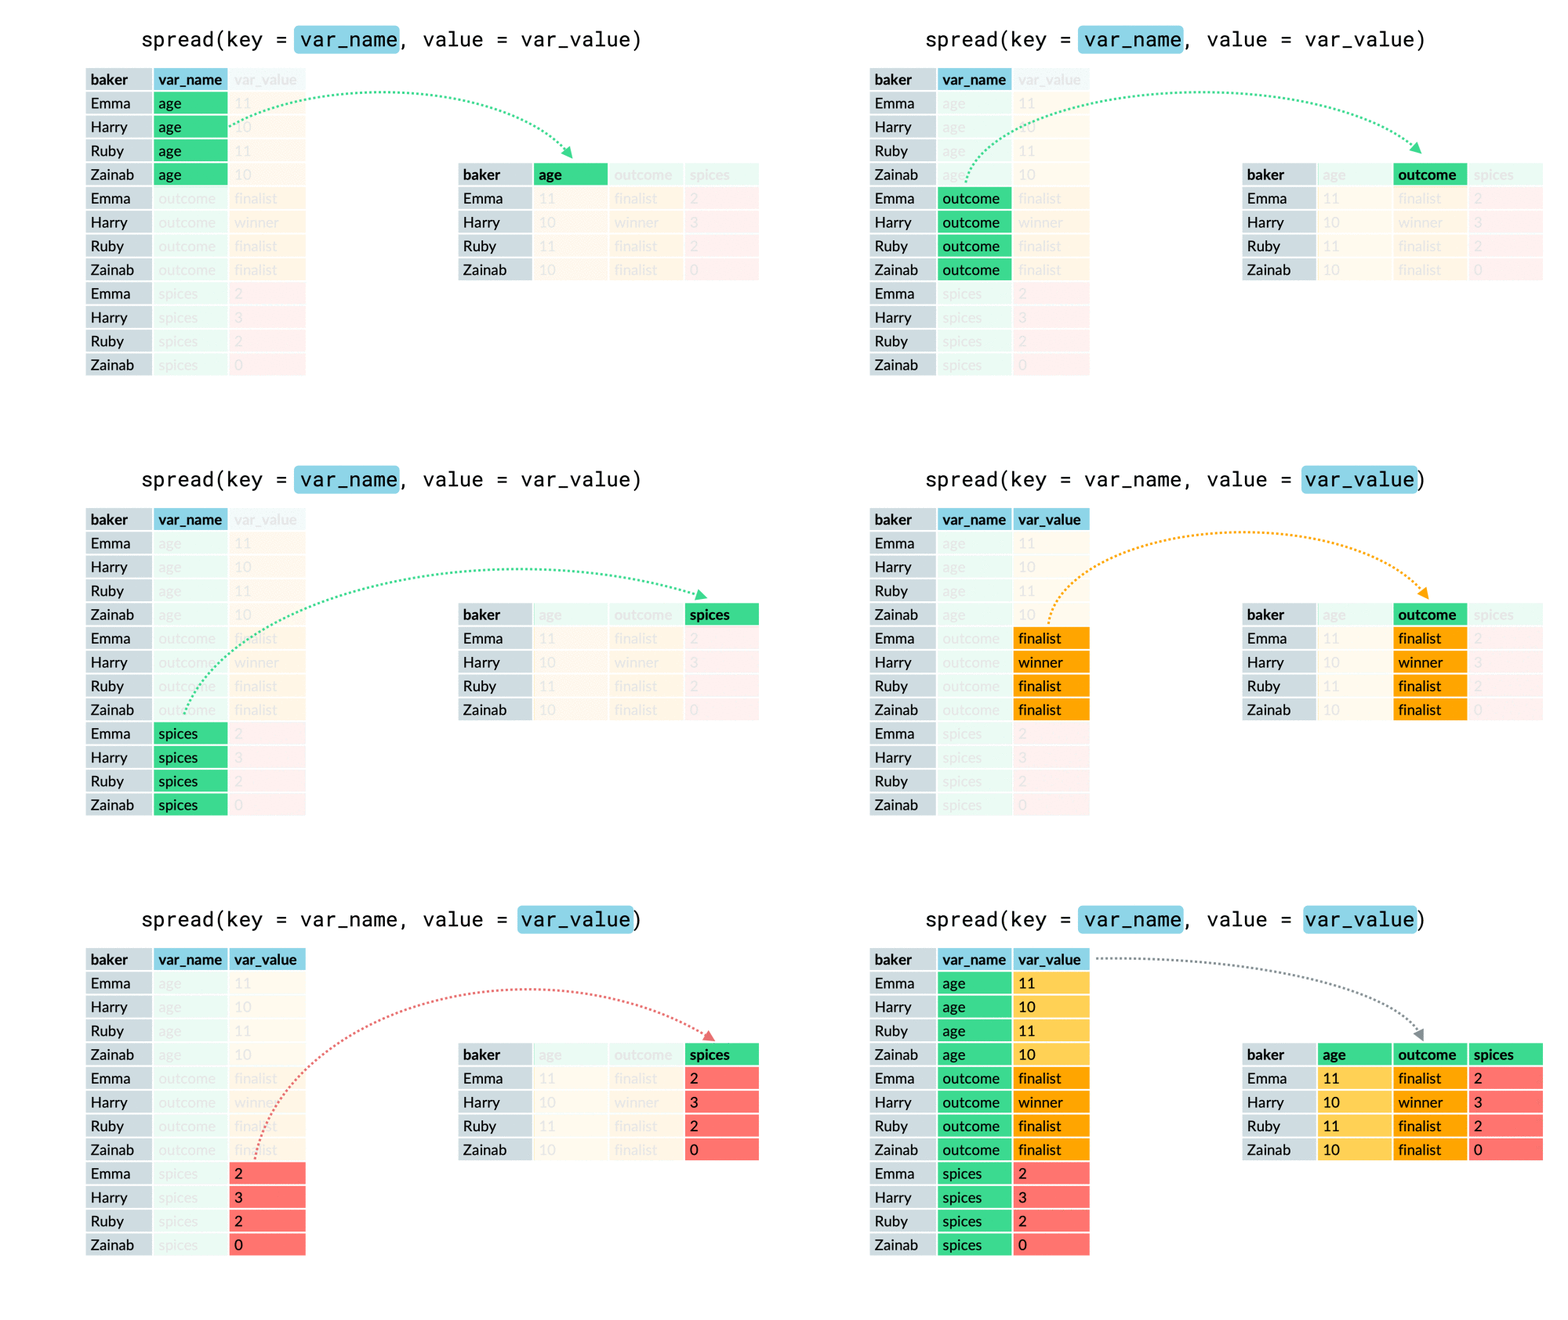
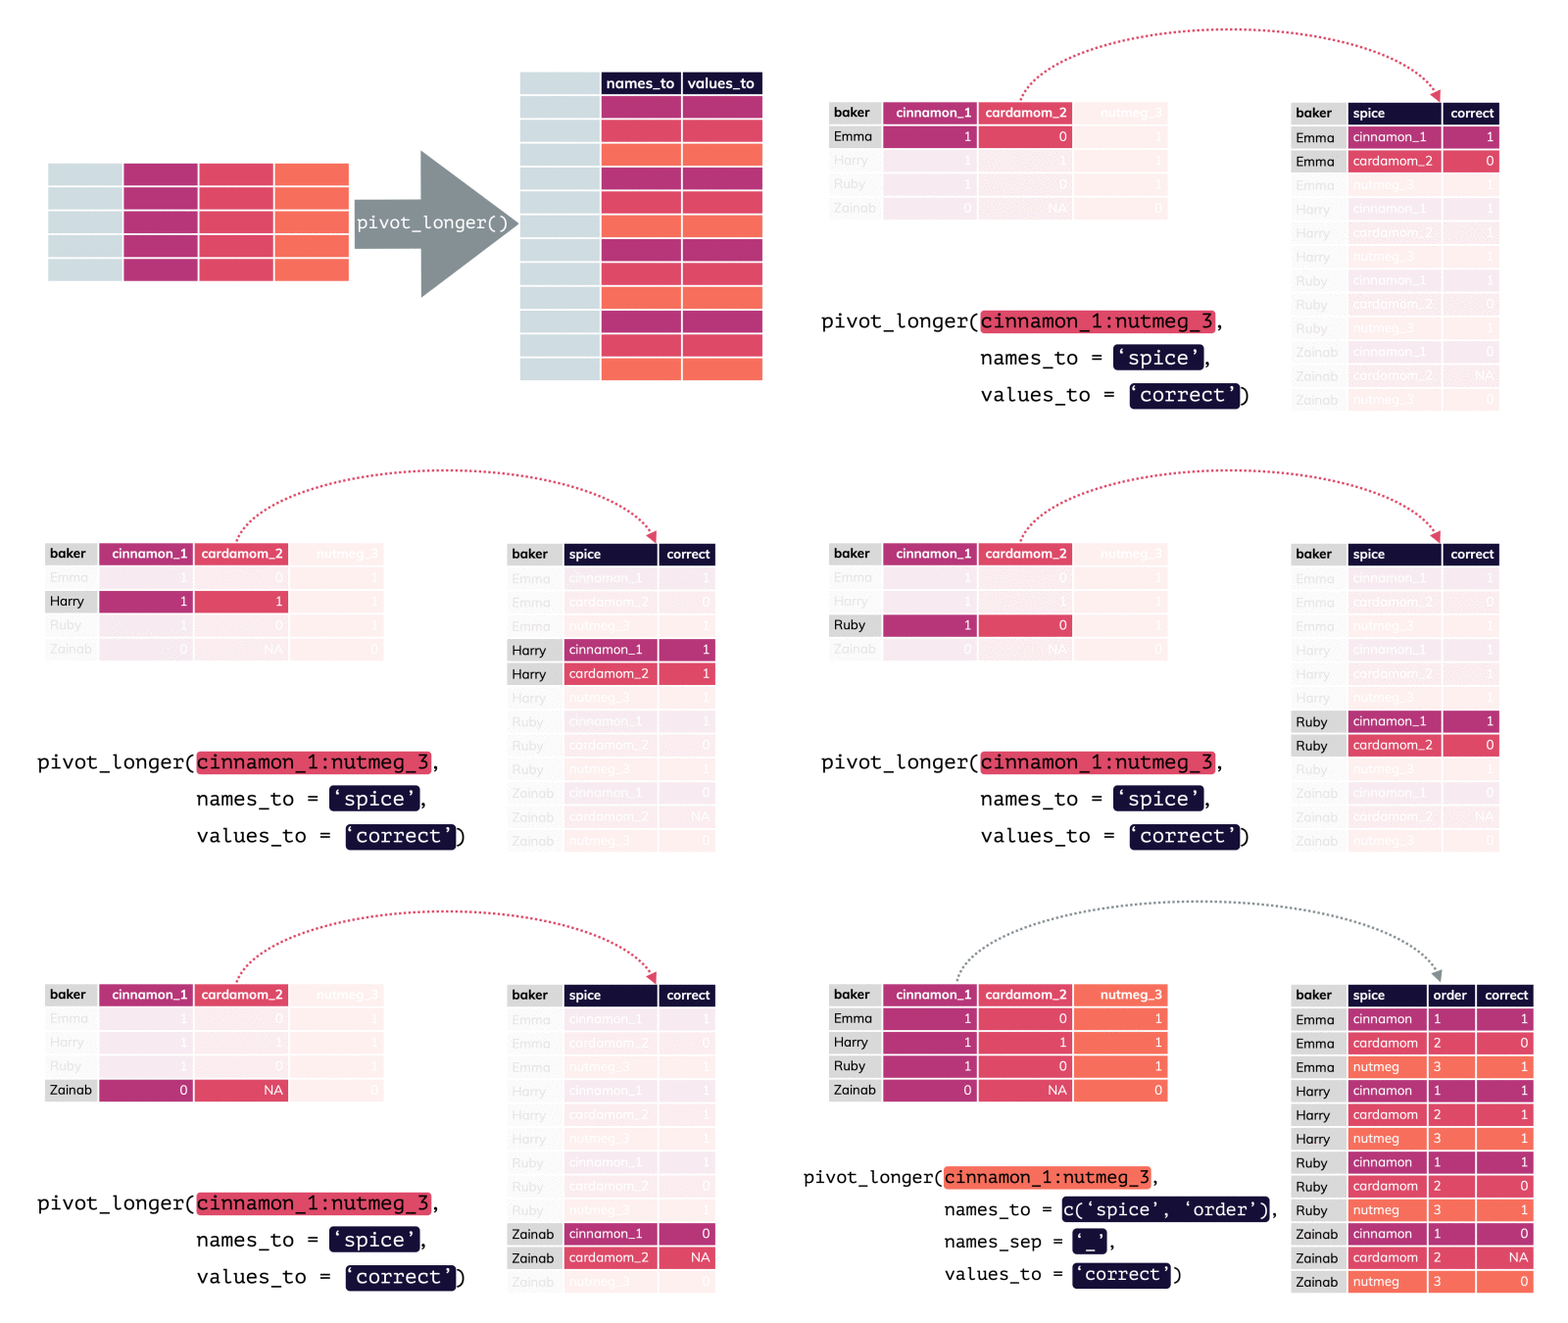
pivot_longer()
df %>% pivot_longer(cols = , names_to = "...", values_to = "...")df %>% pivot_longer(cols = , names_to = "...", values_to = "...")df %>% pivot_longer(cols = , names_to = "...", values_to = "...")pivot_longer()
